AI Data Analysis Assistant
I built this because I was tired of writing the same EDA scripts over and over. Upload a CSV, Excel, or JSON file, ask a question in plain English, and the system writes the Python, runs it, catches its own errors, and hands you back interactive charts with clear explanations.
How it works
- Drop in a dataset and get an instant auto-report — stats, correlations, outliers, the works
- Ask follow-up questions in natural language. The system writes Python under the hood, runs it in a sandboxed loop that catches and fixes its own errors, then returns Plotly visualizations + plain-language takeaways
- Supports everything from basic EDA to predictive modeling and time-series forecasting
Architecture
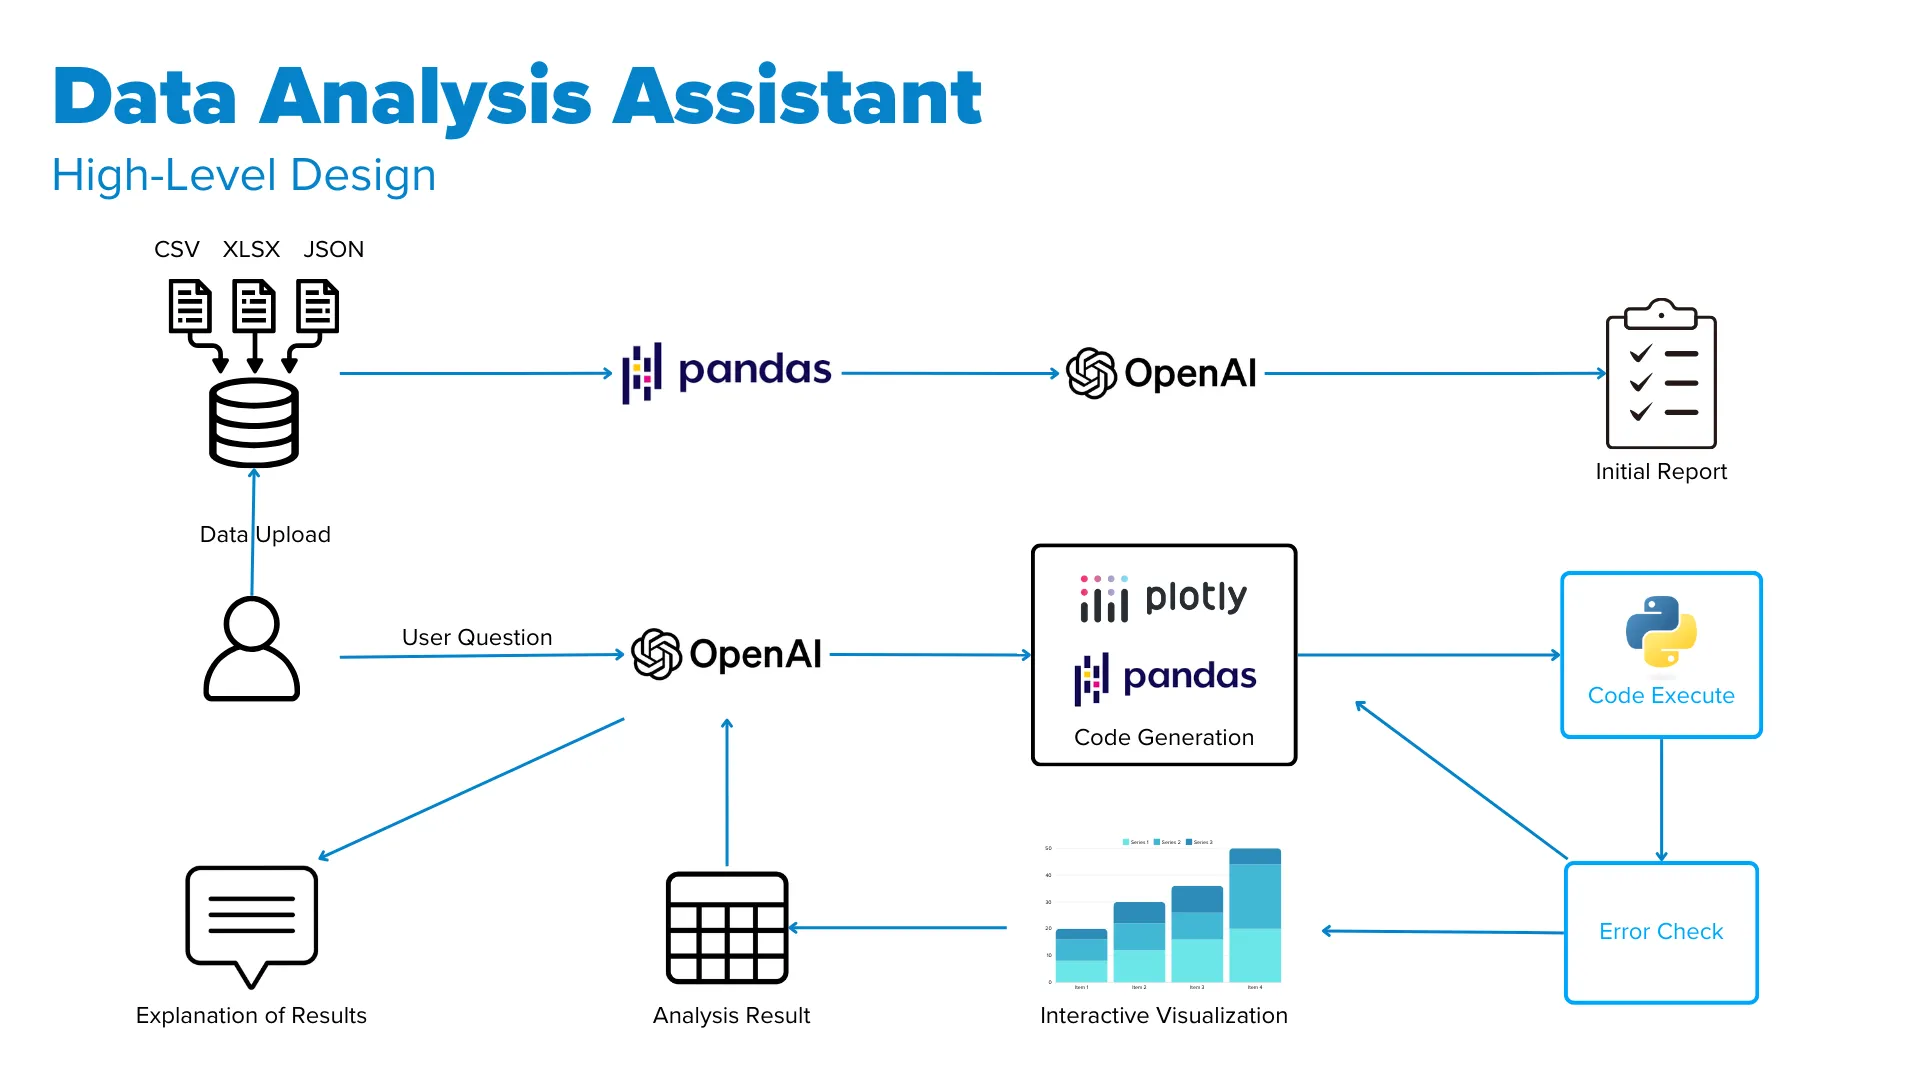
The tech stack combines Python’s pandas for data aggregation, OpenAI’s GPT API for generating insights and writing code, Plotly for interactive visualizations, and an iterative error-handling system that ensures generated code works as intended. The prompts and orchestration can be customized for different organizations and use cases — from tailoring instructions to prioritize specific analyses to integrating domain-specific workflows.
Demo 1: Customer Churn Analysis
Churn rates by contract type and payment method, ML models to predict churn, and analysis of which features are most predictive of customer retention and loss.
Demo 2: Apple Financial Statement Analysis
Key financial metrics over time, comparison of latest financial ratios, and revenue/asset/free cash flow forecasting using Prophet.
Demo 3: Comparative Retailer Analysis
Side-by-side financial analysis of apparel retailers with bubble charts, box and violin plots, heatmaps, and waterfall charts.